Anisotropic yield function parameter identification tool
MatYLD
Anisotropic yield function parameter identification tool
MatYLD
MatYLD Features
MatYLD is a tool for identifying anisotropic parameters of yield functions.
By easily calibrating the parameters of advanced yield functions from experimental results, it enhances the representation of wrinkling behavior during forming in press forming simulations and enables highly accurate springback analysis.
Feature Highlights
- High-accuracy analysis of high-strength aluminum sheets
- Advanced yield function parameters are identified from experimental results.
- Highly accurate wrinkling and springback analysis
Anisotropic yield function parameter identification tool
MatYLD is a tool for identifying anisotropic parameters of yield functions.
By easily calibrating the parameters of advanced yield functions from experimental results, it enhances the representation of wrinkling behavior during forming in press forming simulations and enables highly accurate springback analysis.
Automatic identification of anisotropic yield function parameters
In high-strength aluminum sheets and highly anisotropic steel sheets, the representation capability of the yield function has a significant impact on simulation accuracy.
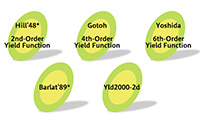
By using MatYLD, the parameters of advanced yield functions such as Yoshida, Yld2000-2d, and Gotoh can be easily identified from experimental results.
By using MatYLD, the parameters of advanced yield functions such as Yoshida, Yld2000-2d, and Gotoh can be easily identified from experimental results.

Support for advanced yield functions
Parameters of advanced yield functions, such as Yoshida, Yld2000-2d, and Gotoh, can be identified.
The parameters of various anisotropic yield functions can be calibrated from a limited set of experimental data, including uniaxial tensile test data in three directions of the sheet (flow stress and yield stresses: σ0, σ45, σ90; r-values: r0, r45, r90) and equi-biaxial tensile stress (σb).
The parameters of various anisotropic yield functions can be calibrated from a limited set of experimental data, including uniaxial tensile test data in three directions of the sheet (flow stress and yield stresses: σ0, σ45, σ90; r-values: r0, r45, r90) and equi-biaxial tensile stress (σb).
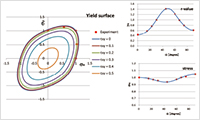
Graph plotting for better understanding of material behavior
Using the identified or user-specified parameters, graphs of yield surfaces representing material behavior, as well as uniaxial flow stress and r-values, can be generated.
These visualization features provide useful graphs for deeper understanding and evaluation of material behavior.
These visualization features provide useful graphs for deeper understanding and evaluation of material behavior.