
J-OCTA
J-OCTA
Estimating Physical Properties Using σ-profile as Descriptors in Machine Learning
- Prediction of glass transition temperature using σ-profiles estimated by machine learning as descriptors
- Usefulness as descriptors
- Analysis of correlations between chemical structure and physical properties
High-speed calculation of σ-profiles using machine learning
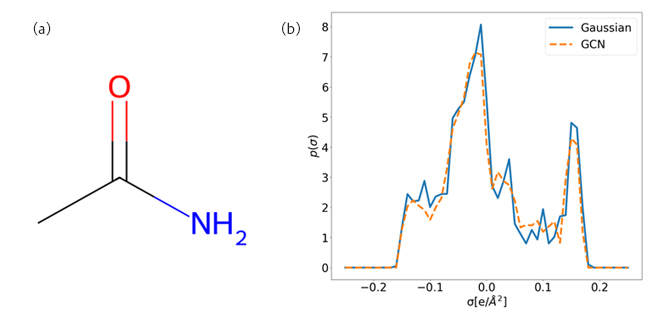
A comparison of σ-profiles for acetamide obtained by quantum chemical calculations and by prediction using a graph convolutional network (GCN) is shown. The blue line represents the quantum chemical calculation, and the orange line represents the machine learning prediction. Their good agreement demonstrates that GCN can predict σ-profiles quickly and accurately.
Usefulness as a descriptor
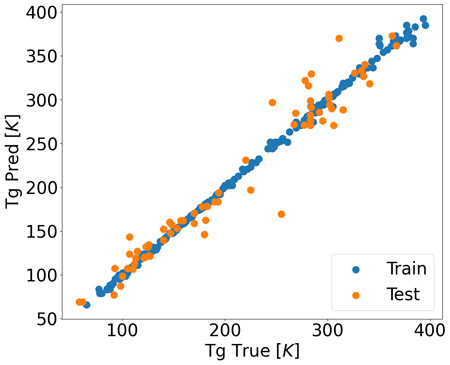
The prediction results of the glass transition temperature (Tg) using XGBoost are shown. The vertical axis represents predicted values and the horizontal axis represents experimental values. High accuracy was achieved with R² = 0.999 for training data and R² = 0.942 for test data. This demonstrates the effectiveness of the machine learning model using σ-profiles as descriptors.
Correlation analysis between chemical structure and physical properties
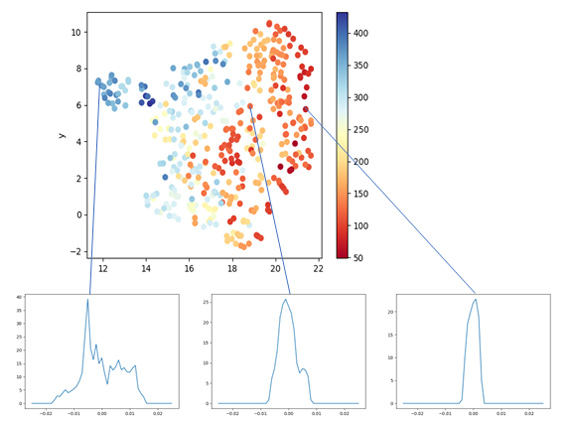
The mapping results of σ-profiles reduced in dimensionality by UMAP are shown. Each point represents a substance, and the color indicates the Tg value. The X-axis represents features affecting Tg, and the shape of the σ-profiles suggests that molecular polarization contributes to Tg.
[2] S. -T. Lin and S. I. Sandler, Ind. Eng. Chem. Res., 2002, 41, 899 ( https://doi.org/10.1021/ie001047w )
[3] D. O. Abranches et al., JCTC, 2023, 19, 9318 ( https://doi.org/10.1021/acs.jctc.3c01003 )
[4] T. Galeazzo and M. Shiraiwa , Environ. Sci. Atmos., 2022, 2 , 362-374
[5] L. McInnes et al., JOSS, 2018, 3, 861 ( https://doi.org/10.21105/joss.00861 )
Related Information
Solutions